AI tools for data visualization tools for data scientists
Related Tools:
Posit
Posit is an open-source data science company that provides a suite of tools and services for data scientists. Its products include the RStudio IDE, Shiny, and Posit Connect. Posit also offers cloud-based solutions and enterprise support. The company's mission is to make data science accessible to everyone, regardless of their economic means or technical expertise.

Streamlit
Streamlit is a web application framework that allows data scientists and machine learning engineers to create interactive web applications quickly and easily. It simplifies the process of building and sharing data-focused applications by providing a simple Python script that can be turned into a shareable web app with just a few lines of code. With Streamlit, users can create interactive visualizations, dashboards, and machine learning models without the need for web development expertise.
Compact Data Science
Compact Data Science is a data science platform that provides a comprehensive set of tools and resources for data scientists and analysts. The platform includes a variety of features such as data preparation, data visualization, machine learning, and predictive analytics. Compact Data Science is designed to be easy to use and accessible to users of all skill levels.
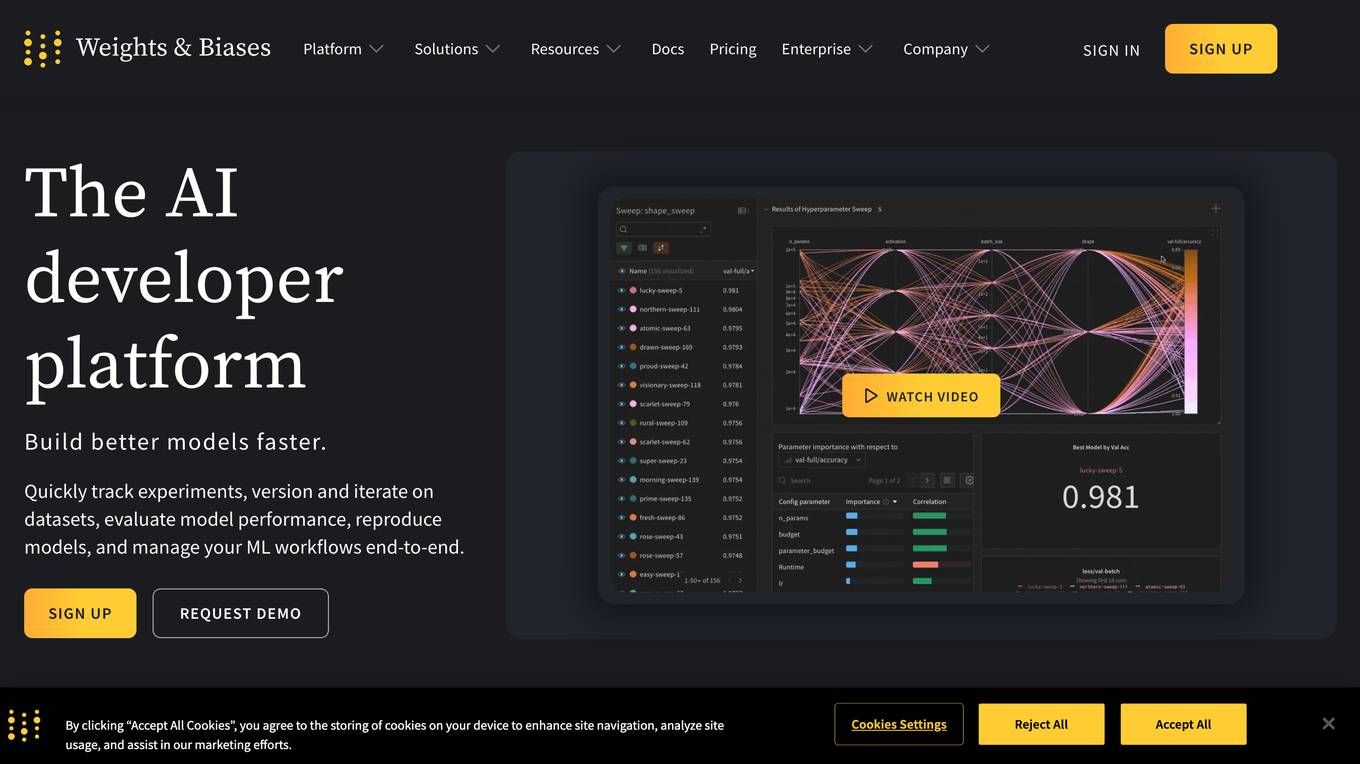
Weights & Biases
Weights & Biases is a machine learning platform that helps data scientists and engineers build, train, and deploy machine learning models. It provides a central location to track and manage all of your machine learning projects, and it offers a variety of tools to help you collaborate with others and share your work.
Fluent
Fluent is an AI-powered data analytics platform that helps businesses explore their data and uncover insights. It uses natural language processing to understand user questions and generate SQL queries to retrieve data from a variety of sources. Fluent also provides visualizations and dashboards to help users understand their data and make informed decisions.
DVC Studio
DVC Studio is a collaboration tool for machine learning teams. It provides seamless data and model management, experiment tracking, visualization, and automation. DVC Studio is built for ML researchers, practitioners, and managers. It enables model organization and discovery across all ML projects and manages model lifecycle with Git, unifying ML projects with the best DevOps practices. DVC Studio also provides ML experiment tracking, visualization, collaboration, and automation using Git. It applies software engineering and DevOps best-practices to automate ML bookkeeping and model training, enabling easy collaboration and faster iterations.
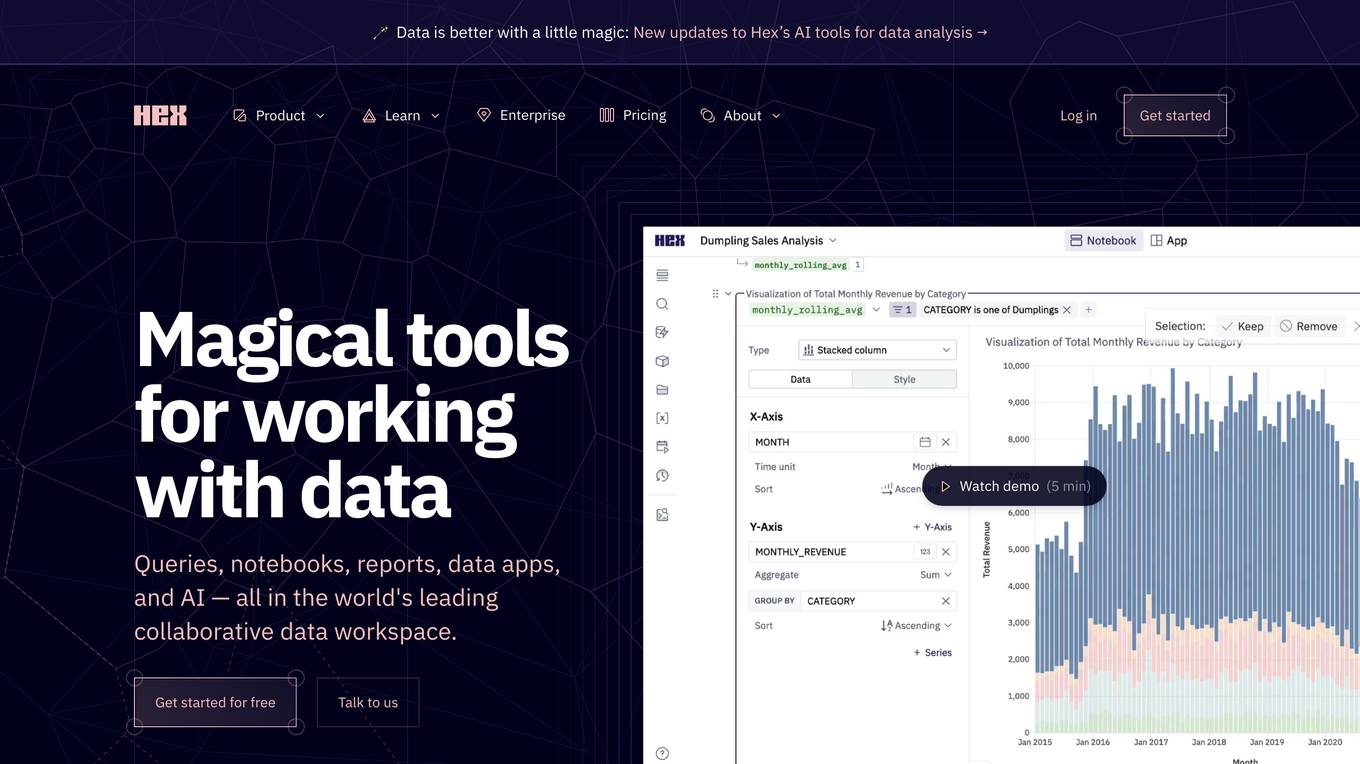
Hex
Hex is a collaborative data workspace that provides a variety of tools for working with data, including queries, notebooks, reports, data apps, and AI. It is designed to be easy to use for people of all technical skill levels, and it integrates with a variety of other tools and services. Hex is a powerful tool for data exploration, analysis, and visualization.
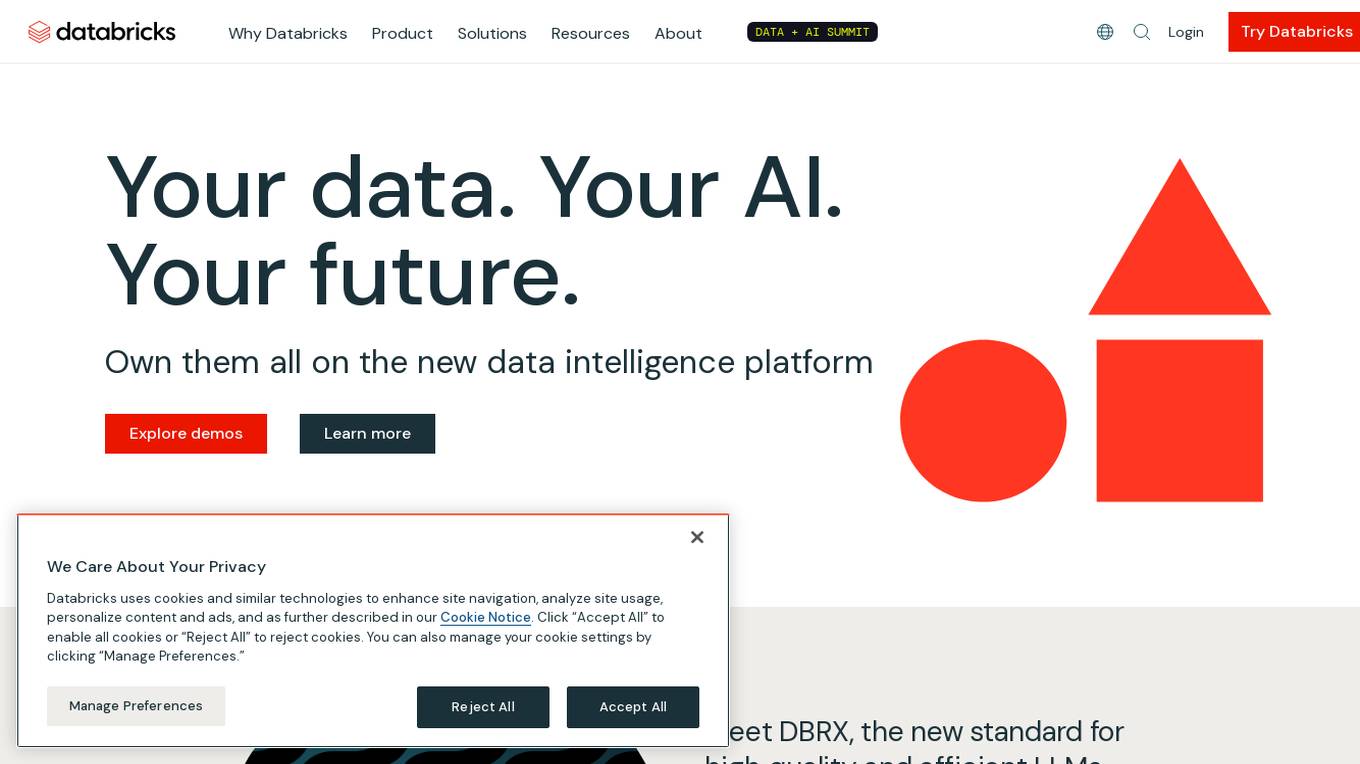
Databricks
Databricks is a data and AI company that provides a unified platform for data, analytics, and AI. The platform includes a variety of tools and services for data management, data warehousing, real-time analytics, data engineering, data science, and AI development. Databricks also offers a variety of integrations with other tools and services, such as ETL tools, data ingestion tools, business intelligence tools, AI tools, and governance tools.
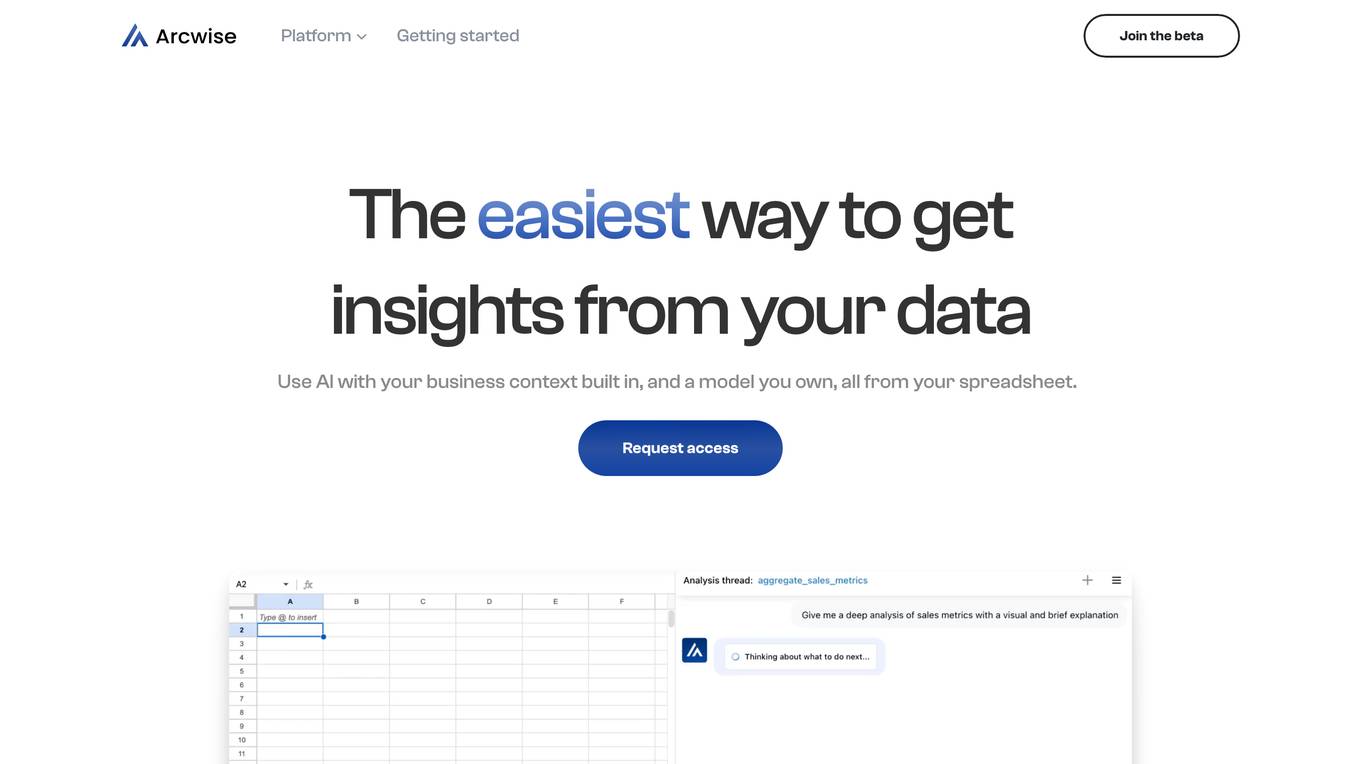
Arcwise
Arcwise is a cloud-based data science platform that provides a comprehensive set of tools for data preparation, exploration, modeling, and deployment. It is designed to make data science accessible to users of all skill levels, from beginners to experts. Arcwise offers a user-friendly interface, drag-and-drop functionality, and a wide range of pre-built templates and algorithms. This makes it easy for users to get started with data science and quickly build and deploy machine learning models.
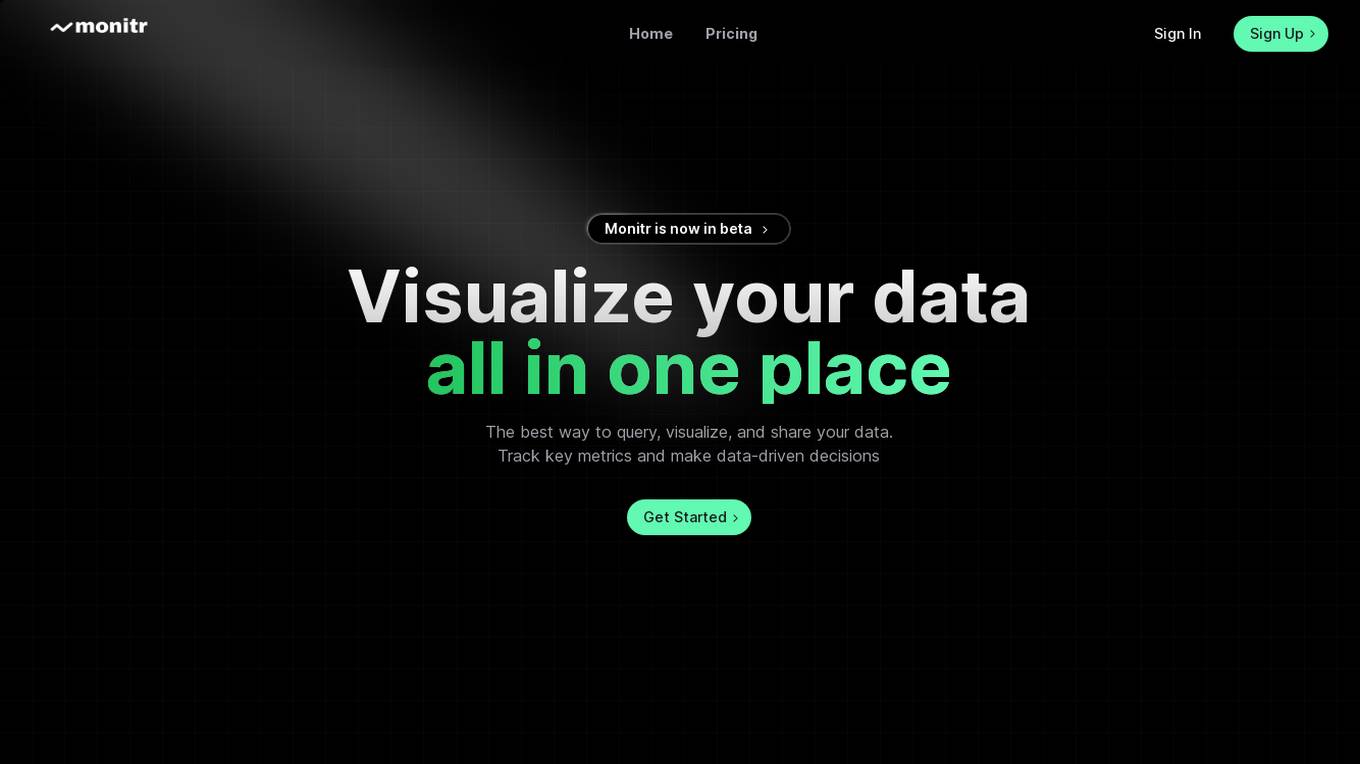
Monitr
Monitr is a data visualization and analytics platform that allows users to query, visualize, and share data in one place. It helps in tracking key metrics, making data-driven decisions, and breaking down data silos to provide a unified view of data from various sources. Users can create charts and dashboards, connect to different data sources like Postgresql and MySQL, and collaborate with teammates on SQL queries. Monitr's AI features are powered by Meta AI's Llama 3 LLM, enabling the development of powerful and flexible analytics tools for maximizing data utilization.
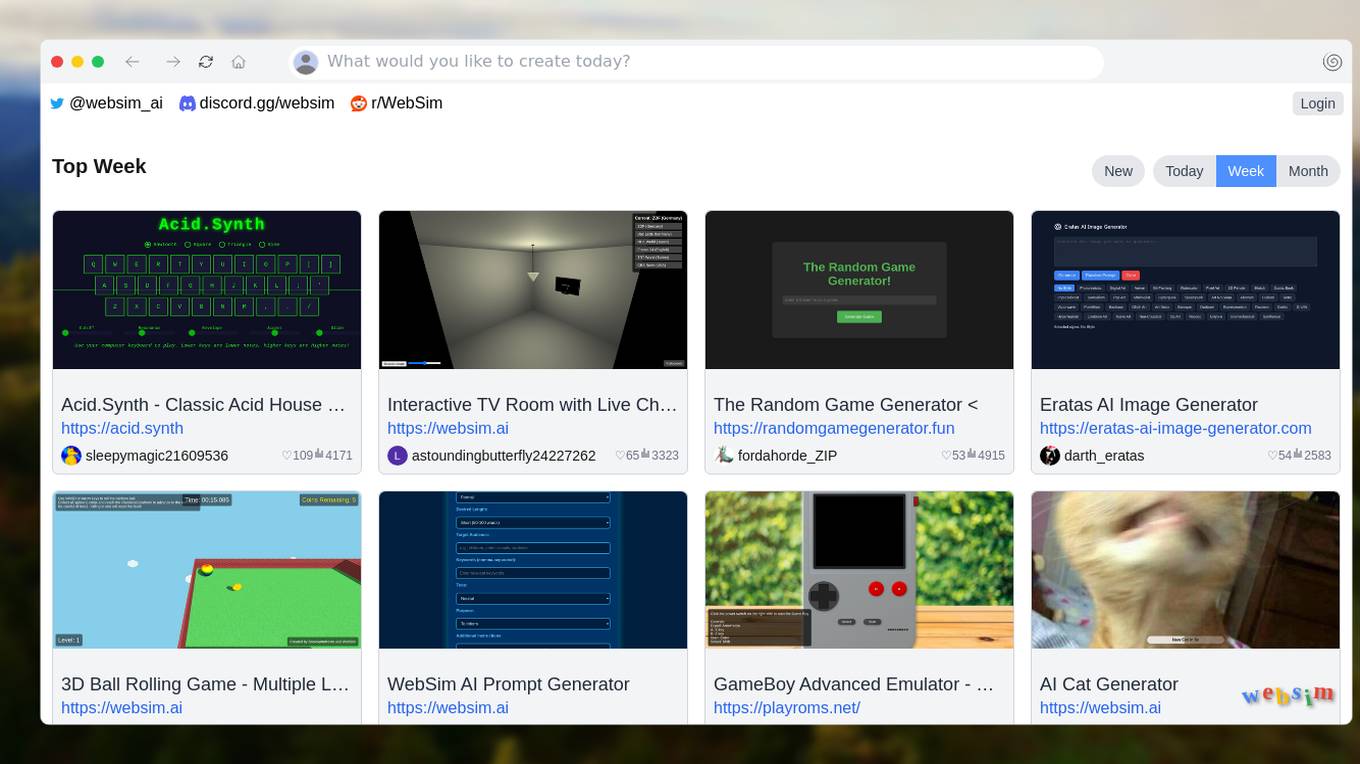
Websim.ai
Websim.ai is an advanced AI tool designed to provide users with a powerful platform for simulating and analyzing web data. With cutting-edge algorithms and machine learning capabilities, Websim.ai offers a comprehensive suite of tools for web data analysis, visualization, and prediction. Users can easily upload their data sets, perform complex analyses, and generate insightful reports to gain valuable insights into their web performance and user behavior. Whether you are a data scientist, marketer, or business owner, Websim.ai empowers you to make informed decisions and optimize your online presence.
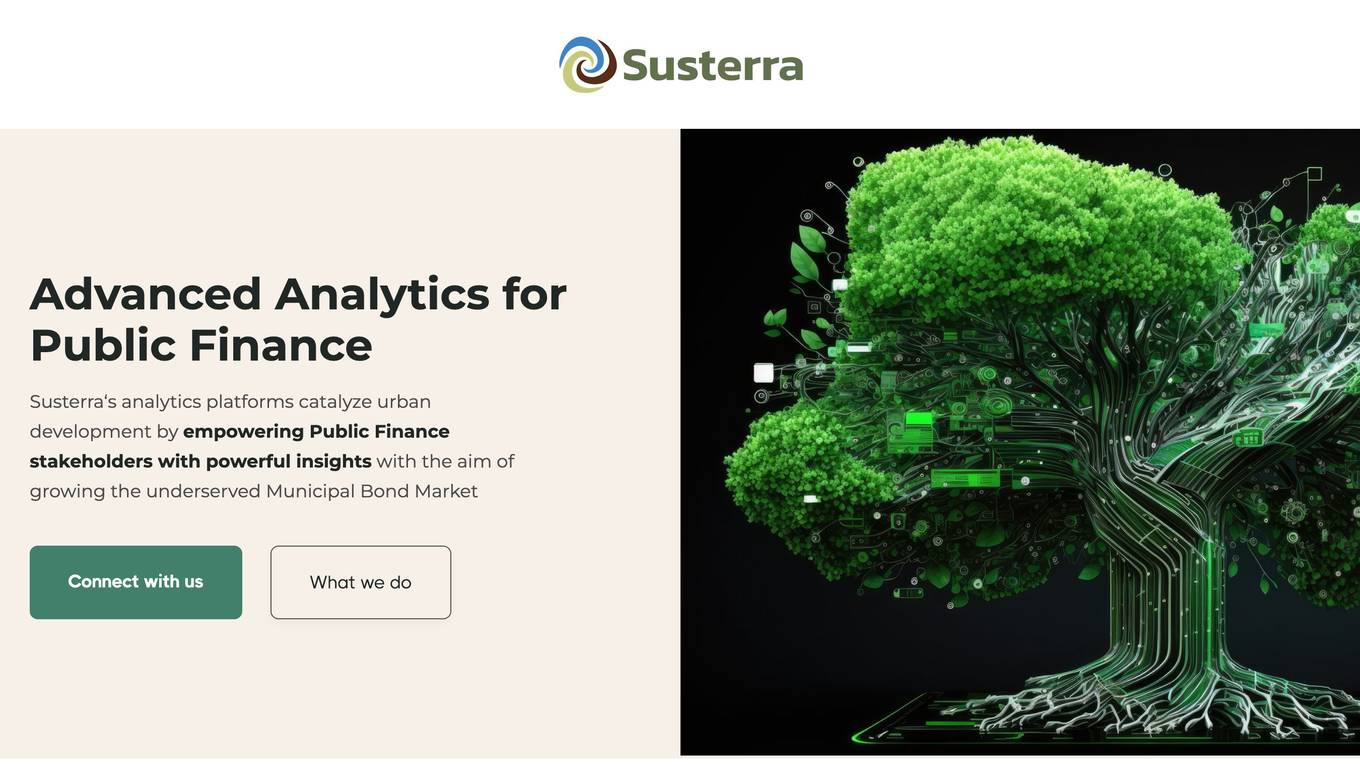
Susterra
Susterra is an advanced analytics platform for Public Finance stakeholders, aiming to catalyze urban development by providing powerful insights. The platform integrates leading practices from academia, utilizes public data for creating relevant insights, and leverages technology innovations like ML and AI. Susterra offers solutions such as TerraScore, TerraVision, TerraView, and Impact IQ, enabling evaluation of public benefit programs in various sectors. The platform also provides data visualization tools and is powered by Google Cloud, offering state-of-the-art analytics for smart decision-making in the Municipal Bond Market and Smart Cities development.
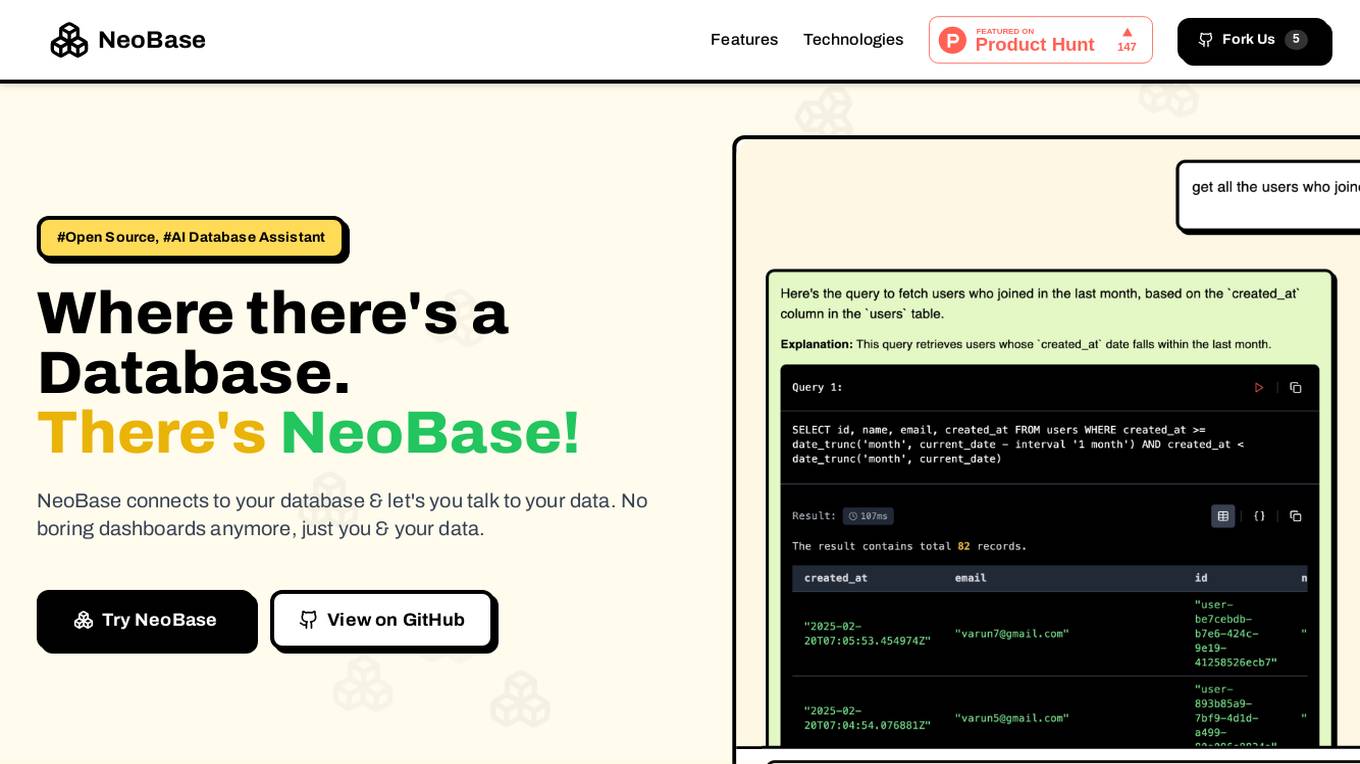
NeoBase
NeoBase is an AI-powered database assistant that helps users efficiently manage and analyze large datasets. It offers advanced features such as data visualization, predictive analytics, and natural language processing capabilities. With NeoBase, users can easily query databases, generate insights, and make data-driven decisions. The application is designed to streamline data-related tasks and enhance productivity for individuals and businesses alike.
Jeda.ai
Jeda.ai is a cutting-edge AI application that offers a Visual AI Workspace for ideation and decision-making. It provides a platform for users to visualize, collaborate, and innovate using various AI tools like AI Template Analysis, AI Note Taking, AI Mind Map Diagrams, AI Flowchart Diagrams, AI Wireframe, AI Text Writer, AI Sticky Notes, AI Art, AI Vision, and Transform. The application caters to a wide range of business cases, including Leadership & Business Development, Product Management, Marketing, Sales, User Experience & Product Design, Design, Human Resources, Retrospective Analysis, Engineering, and Software Development. Jeda.ai aims to transform ideas into stunning visuals and data into strategic insights, helping users drive success and outpace their competition.
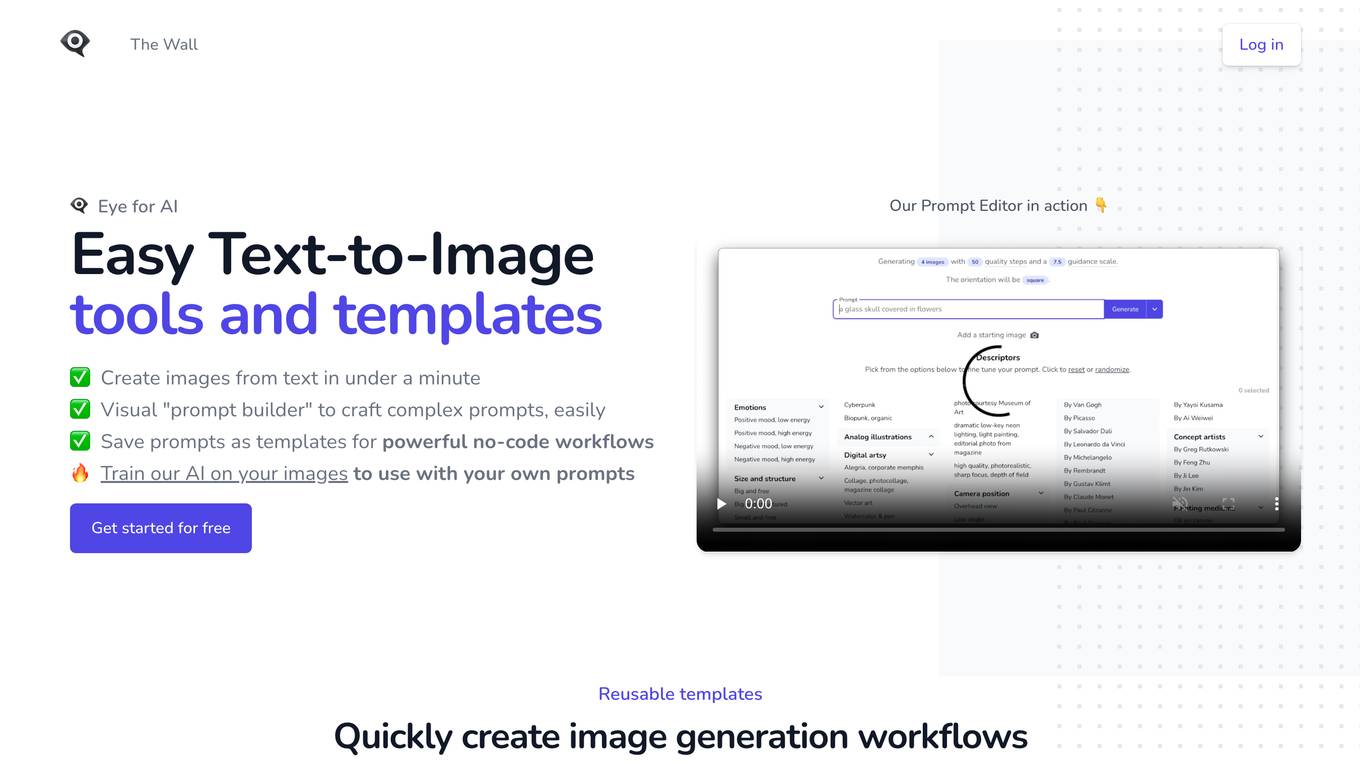
Eye for AI
Eye for AI is a comprehensive AI-powered platform that provides a wide range of tools and resources to help businesses and individuals harness the power of AI. With Eye for AI, users can access cutting-edge AI technologies, including natural language processing, computer vision, and machine learning, to automate tasks, improve decision-making, and gain valuable insights from data.
OGBRAIN
OGBRAIN is a website that provides Crypto Data Intelligence, Market Analytics, and On-Chain Insights. The platform offers a wide range of information related to cryptocurrencies, including market trends, prices, market capitalization, and trading volumes. Users can access real-time data on various cryptocurrencies and stay updated on the latest news and trends in the crypto market.
Dataiku
Dataiku is an end-to-end platform for data and AI projects. It provides a range of capabilities, including data preparation, machine learning, data visualization, and collaboration tools. Dataiku is designed to make it easy for users to build, deploy, and manage AI projects at scale.
Latitude
Latitude is an open-source framework for building interactive data apps using code. It provides a workspace for data analysts to streamline their workflow, connect to various data sources, perform data transformations, create visualizations, and collaborate with others. Latitude aims to simplify the data analysis process by offering features such as data snapshots, a data profiler, a built-in AI assistant, and tight integration with dbt.
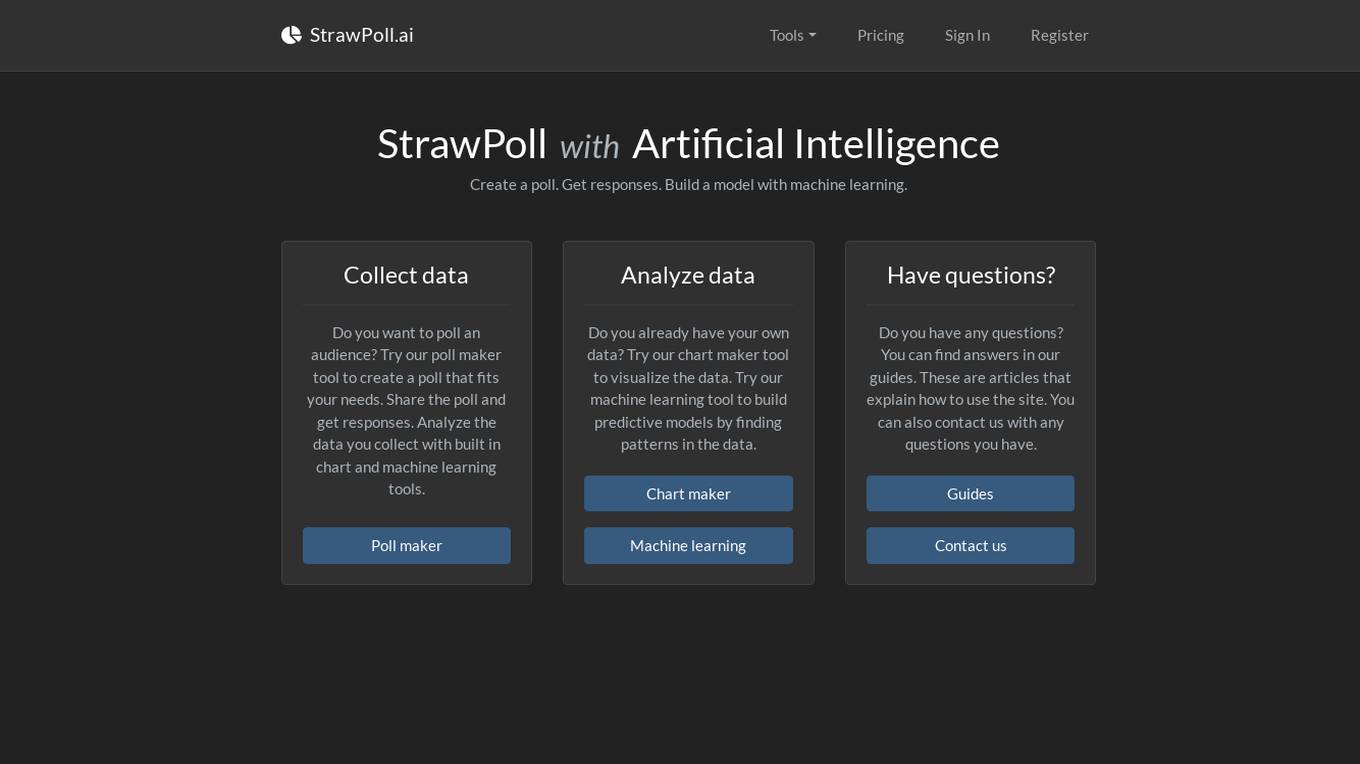
StrawPoll.ai
StrawPoll.ai is an AI-powered platform that offers tools for creating polls, generating charts, and utilizing machine learning to analyze data. Users can easily create polls tailored to their needs, share them to collect responses, and analyze the data using built-in chart and machine learning tools. The platform also provides a chart maker tool for visualizing existing data and a machine learning tool for building predictive models by identifying patterns in the data. Additionally, users can access guides for assistance and contact support for any queries.
Basedash
Basedash is an AI-powered data visualization and management tool that enables teams to collaborate and share insights from their databases. It offers features such as a user-friendly interface, customizable dashboards, and powerful SQL editing capabilities. Basedash is designed to streamline data exploration, analysis, and decision-making, making it suitable for various use cases, including customer relationship management, product development, and data-driven decision-making.
Emmi Data Analysis and Visualizer
Expert in data analysis and visualization, offering clear explanations and guidance.
Epidemic Global Insight System
Advanced epidemiology expert with AI-driven data integration and dynamic visualization tools.
Data Analytics Specialist
Leading Big Data Analytics tool, blending advanced technology with OpenAI's expertise.
POWERBI_AI
“Data Deep Dive”: This is an expert AI tool for Excel and Power BI. Get expert help with DAX, Power Query, VBA, data models, and visualizations. Ideal for all levels: from basic functions to advanced analytics.
Data Insight Guru
Concise stats, data analysis, and viz expert. Clear, brief, asks for clarifications.
Neuro Code Helper
A neural signal processing engineer, skilled in MATLAB and Python coding assistance.

Plotter
Provide a hand-drawing or screenshot of your desired plot along with the data and I'll make the plot.
Diagrams: Show Me | charts, presentations, code
Diagram creation: flowcharts, mindmaps, UML, chart, PlotUML, workflow, sequence, ERD, database & architecture visualization for code, presentations and documentation. [New] Add a logo or any image to graph diagrams. Easy Download & Edit
Diagramas: Muéstrame
Cree diagramas, visualizaciones de arquitectura, diagramas de flujo, mapas mentales, esquemas y más. Ideal para codificación, presentaciones y documentación de códigos. ¡Exporta y edita tu diagrama gratis!
awesome-mlops
Awesome MLOps is a curated list of tools related to Machine Learning Operations, covering areas such as AutoML, CI/CD for Machine Learning, Data Cataloging, Data Enrichment, Data Exploration, Data Management, Data Processing, Data Validation, Data Visualization, Drift Detection, Feature Engineering, Feature Store, Hyperparameter Tuning, Knowledge Sharing, Machine Learning Platforms, Model Fairness and Privacy, Model Interpretability, Model Lifecycle, Model Serving, Model Testing & Validation, Optimization Tools, Simplification Tools, Visual Analysis and Debugging, and Workflow Tools. The repository provides a comprehensive collection of tools and resources for individuals and teams working in the field of MLOps.

ai-data-science-team
The AI Data Science Team of Copilots is an AI-powered data science team that uses agents to help users perform common data science tasks 10X faster. It includes agents specializing in data cleaning, preparation, feature engineering, modeling, and interpretation of business problems. The project is a work in progress with new data science agents to be released soon. Disclaimer: This project is for educational purposes only and not intended to replace a company's data science team. No warranties or guarantees are provided, and the creator assumes no liability for financial loss.
awesome-ai-tools
This repository contains a curated list of awesome AI tools that can be used for various machine learning and artificial intelligence projects. It includes tools for data preprocessing, model training, evaluation, and deployment. The list is regularly updated with new tools and resources to help developers and data scientists in their AI projects.
supervisely
Supervisely is a computer vision platform that provides a range of tools and services for developing and deploying computer vision solutions. It includes a data labeling platform, a model training platform, and a marketplace for computer vision apps. Supervisely is used by a variety of organizations, including Fortune 500 companies, research institutions, and government agencies.
ROGRAG
ROGRAG is a powerful open-source tool designed for data analysis and visualization. It provides a user-friendly interface for exploring and manipulating datasets, making it ideal for researchers, data scientists, and analysts. With ROGRAG, users can easily import, clean, analyze, and visualize data to gain valuable insights and make informed decisions. The tool supports a wide range of data formats and offers a variety of statistical and visualization tools to help users uncover patterns, trends, and relationships in their data. Whether you are working on exploratory data analysis, statistical modeling, or data visualization, ROGRAG is a versatile tool that can streamline your workflow and enhance your data analysis capabilities.
awesome-generative-ai-data-scientist
A curated list of 50+ resources to help you become a Generative AI Data Scientist. This repository includes resources on building GenAI applications with Large Language Models (LLMs), and deploying LLMs and GenAI with Cloud-based solutions.
Fueling-Ambitions-Via-Book-Discoveries
Fueling-Ambitions-Via-Book-Discoveries is an Advanced Machine Learning & AI Course designed for students, professionals, and AI researchers. The course integrates rigorous theoretical foundations with practical coding exercises, ensuring learners develop a deep understanding of AI algorithms and their applications in finance, healthcare, robotics, NLP, cybersecurity, and more. Inspired by MIT, Stanford, and Harvard’s AI programs, it combines academic research rigor with industry-standard practices used by AI engineers at companies like Google, OpenAI, Facebook AI, DeepMind, and Tesla. Learners can learn 50+ AI techniques from top Machine Learning & Deep Learning books, code from scratch with real-world datasets, projects, and case studies, and focus on ML Engineering & AI Deployment using Django & Streamlit. The course also offers industry-relevant projects to build a strong AI portfolio.
LLM-Agents-Papers
A repository that lists papers related to Large Language Model (LLM) based agents. The repository covers various topics including survey, planning, feedback & reflection, memory mechanism, role playing, game playing, tool usage & human-agent interaction, benchmark & evaluation, environment & platform, agent framework, multi-agent system, and agent fine-tuning. It provides a comprehensive collection of research papers on LLM-based agents, exploring different aspects of AI agent architectures and applications.
awesome-generative-ai
A curated list of Generative AI projects, tools, artworks, and models
taipy
Taipy is an open-source Python library for easy, end-to-end application development, featuring what-if analyses, smart pipeline execution, built-in scheduling, and deployment tools.
dataset-viewer
Dataset Viewer is a modern, high-performance tool built with Tauri, React, and TypeScript, designed to handle massive datasets from multiple sources with efficient streaming for large files (100GB+) and lightning-fast search capabilities. It supports instant large file opening, real-time search, direct archive preview, multi-protocol and multi-format support, and features a modern interface with dark/light themes and responsive design. The tool is perfect for data scientists, log analysis, archive management, remote access, and performance-critical tasks.
Awesome-Code-LLM
Analyze the following text from a github repository (name and readme text at end) . Then, generate a JSON object with the following keys and provide the corresponding information for each key, in lowercase letters: 'description' (detailed description of the repo, must be less than 400 words,Ensure that no line breaks and quotation marks.),'for_jobs' (List 5 jobs suitable for this tool,in lowercase letters), 'ai_keywords' (keywords of the tool,user may use those keyword to find the tool,in lowercase letters), 'for_tasks' (list of 5 specific tasks user can use this tool to do,in lowercase letters), 'answer' (in english languages)
awesome-transformer-nlp
This repository contains a hand-curated list of great machine (deep) learning resources for Natural Language Processing (NLP) with a focus on Generative Pre-trained Transformer (GPT), Bidirectional Encoder Representations from Transformers (BERT), attention mechanism, Transformer architectures/networks, Chatbot, and transfer learning in NLP.
awesome-ai-cybersecurity
This repository is a comprehensive collection of resources for utilizing AI in cybersecurity. It covers various aspects such as prediction, prevention, detection, response, monitoring, and more. The resources include tools, frameworks, case studies, best practices, tutorials, and research papers. The repository aims to assist professionals, researchers, and enthusiasts in staying updated and advancing their knowledge in the field of AI cybersecurity.
MegaDetector
MegaDetector is an AI model that identifies animals, people, and vehicles in camera trap images (which also makes it useful for eliminating blank images). This model is trained on several million images from a variety of ecosystems. MegaDetector is just one of many tools that aims to make conservation biologists more efficient with AI. If you want to learn about other ways to use AI to accelerate camera trap workflows, check out our of the field, affectionately titled "Everything I know about machine learning and camera traps".

llms-tools
The 'llms-tools' repository is a comprehensive collection of AI tools, open-source projects, and research related to Large Language Models (LLMs) and Chatbots. It covers a wide range of topics such as AI in various domains, open-source models, chats & assistants, visual language models, evaluation tools, libraries, devices, income models, text-to-image, computer vision, audio & speech, code & math, games, robotics, typography, bio & med, military, climate, finance, and presentation. The repository provides valuable resources for researchers, developers, and enthusiasts interested in exploring the capabilities of LLMs and related technologies.
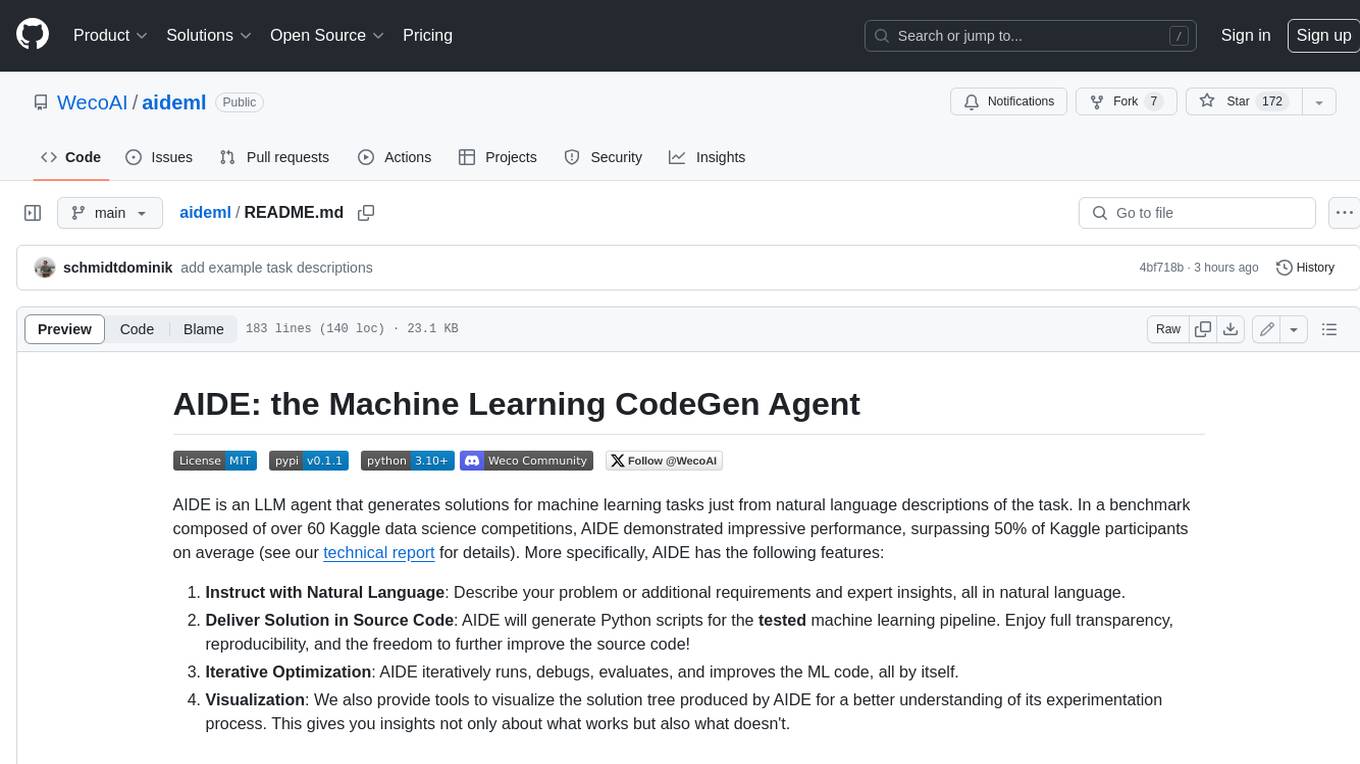
aideml
AIDE is a machine learning code generation agent that can generate solutions for machine learning tasks from natural language descriptions. It has the following features: 1. **Instruct with Natural Language**: Describe your problem or additional requirements and expert insights, all in natural language. 2. **Deliver Solution in Source Code**: AIDE will generate Python scripts for the **tested** machine learning pipeline. Enjoy full transparency, reproducibility, and the freedom to further improve the source code! 3. **Iterative Optimization**: AIDE iteratively runs, debugs, evaluates, and improves the ML code, all by itself. 4. **Visualization**: We also provide tools to visualize the solution tree produced by AIDE for a better understanding of its experimentation process. This gives you insights not only about what works but also what doesn't. AIDE has been benchmarked on over 60 Kaggle data science competitions and has demonstrated impressive performance, surpassing 50% of Kaggle participants on average. It is particularly well-suited for tasks that require complex data preprocessing, feature engineering, and model selection.